A slide deck with various examples
Jeremy Fix
April 23, 2025
Slides made with slidemakerUnnumbered lists like this:
- Galileo Galilei
- Robert G. Ingersoll
- Jill Tarter
Within the makefile, the lists appear incrementally due to the
-i
. However, you can depart from this default as stated in
the pandoc
documentation
Numbered lists like this:
1. Naïve realists
1. Scientific realists
1. Constructive empiricists
1. Positivists
1. Relativists
This markdown memo has been inspired by this memo which is hosted by https://github.com
Here’s how you do a footnote1.
The following is a quote block.
> It ain't what you don't know that gets you into trouble.
> It's what you know for sure that just ain't so.
-- Mark Twain
It ain’t what you don’t know that gets you into trouble. It’s what you know for sure that just ain’t so.
– Mark Twain
For defining a sum in python
And then in the terminal:
fix_jer@stollen:~$ python3 sample.py
Or even C++ code :
We shall write a sequence of math expressions :
\[\begin{align} !n &\sim \frac{n^n}{e^n} \sqrt{2\pi n}\label{eq:1}\\ e^{i \theta}&= \cos(\theta) + i \sin(\theta)\label{eq:2} \end{align}\]
Equation \(\eqref{eq:1}\) is the Stirling’s formula while equation \(\eqref{eq:2}\) is due to Euler. These are typed in as raw latex
\begin{align}
!n &\sim \frac{n^n}{e^n} \sqrt{2\pi n}\label{eq:1}\\
e^{i \theta}&= \cos(\theta) + i \sin(\theta)\label{eq:2}
\end{align}
You can also use familiar environments (see the source):
\[\begin{equation} \begin{split} \gamma(n)&=\sum_{i=1}^{n}x^{2}\\ &=\sum_{i=1}^{n}x\cdot x \end{split} \label{eq:splitSample} \end{equation}\]
Transitions between the slides can be set globally in the yaml file
According to the pandoc documentation you should be able to set it individually on every slide but that did not work in my tests)
You can display content
progressively
by introducing pauses.
It also works
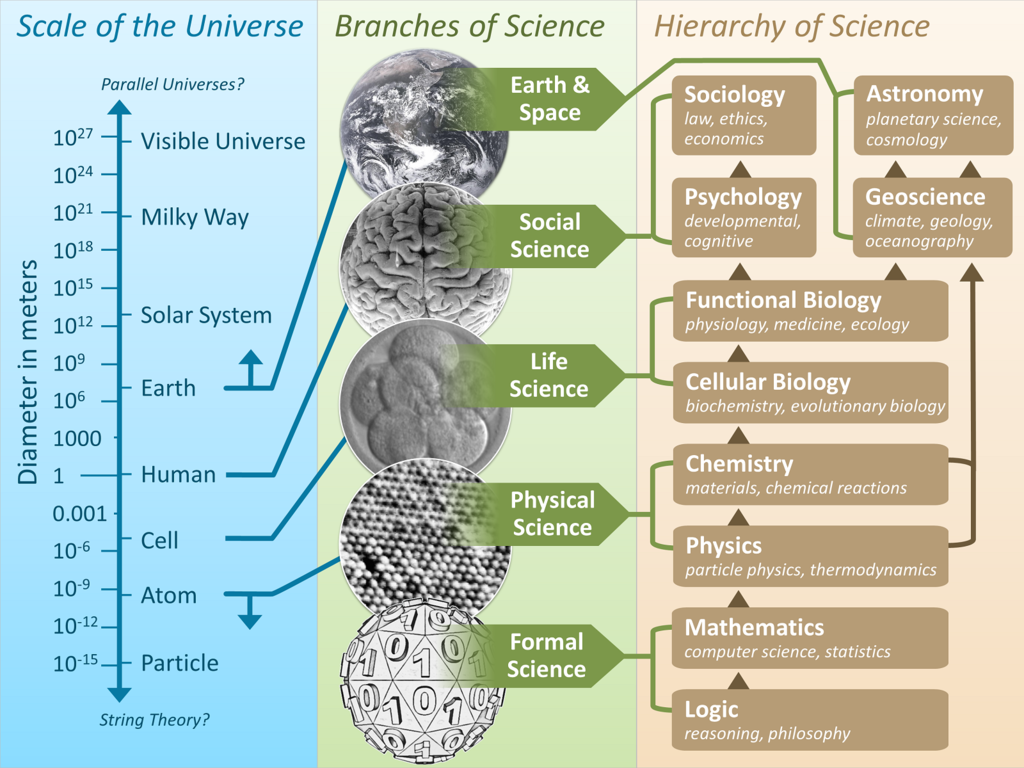
You can put images in your slides with :
And you could cite the image with …
You can put videos in your slides with raw html :
Gallia est omnis divisa in partes tres, quarum unam incolunt Belgae, aliam Aquitani,…
Qua de causa Helvetii quoque reliquos Gallos virtute praecedunt, quod fere cotidianis proeliis cum Germanis contendunt, …
Example of a graph generated from graphviz :
Example of a graph generated from Tikz.
Using the plugin reveal.js-d3, we can embed d3.js animations , this one is taken from d3-graph-gallery
Using the plugin reveal.js-d3, we can embed websites
You can add notes to a slide that are shown only in the speaker view (triggered by pressing the “S” key) or by showing them on every slide by setting the meta.yaml property
Actually you should be able to open the speaker view… but even using
apparently a local server with python3 -m http.server 8000
,
i’m unable to open the speaker view. I do not know why. However, setting
the boolean in the yaml file actually correctly display the notes
aside.
Lorem ipsum dolor sit amet, duo ut putant verear, nam ut brute utroque. Officiis qualisque conceptam te duo, eu vim soluta numquam, has ut aliquip accusamus. Probo aliquam pri id. Mutat singulis ad vis, eam euismod pertinax an, ea tale volumus vel. At porro soleat est. Debet facilis admodum an sed, at falli feugiat est.↩︎